


Deliver fast, reliable service with a cloud system that updates in real-time and scales with your business.

Control your data and infrastructure with a secure, offline-ready solution tailored for complex environments.

Empower customers to check in, book, or update their appointments without staff assistance.

Deliver fast, secure access for repeat visitors using AI-powered facial recognition.
 Banking
Streamline customer flow and reduce wait times in banks and financial institutions.
 Healthcare
Refine patient check-ins and improve healthcare service.
 Public
Sector
Public
Sector
Manage citizen services smoothly in government offices and public institutions.
 Retail
Improve shopping experiences by minimizing checkout lines and wait times.
 DMV
DMV
Organize customer service queues in automotive showrooms and service centers.
 Airport
Speed up passenger processing with efficient queue management at terminals.
All Industries → AI Appointment Booking System
Automate appointment scheduling with AI-powered booking, smart reminders, and seamless customer check-ins.
 Appointment
Booking
Appointment
Booking
Offer flexible scheduling that helps customers plan their visit and avoid peak-time congestion.
 Biometric
System
Biometric
System
Speed up identity verification and check-ins using facial or fingerprint recognition.
 Automation
Automate workflows and reduce manual tasks with smart queue solutions.
 Virtual
Queuing
Virtual
Queuing
Let customers wait from anywhere home, car, or cafe with mobile-based virtual queues.
 Visitor
Management
Visitor
Management
Track and manage visitor entry, exit, and ID verification from a single dashboard.
 Video
Queue
Video
Queue
Allow people to join video calls instantly with one link—no apps, Accessible on any browser.
 Tele-Consultation
Offer seamless virtual consultations with real-time communication tool.
All Solutions →
Watch quick product demos and tutorials to understand how Qwaiting works for your business.

Read expert insights, tips, and industry trends to enhance customer experience.

Download in-depth guides and resources to explore queue management best practices.

Explore Qwaiting in a quick interactive demo, no signup needed.
applying business intelligence to customer experience delivery
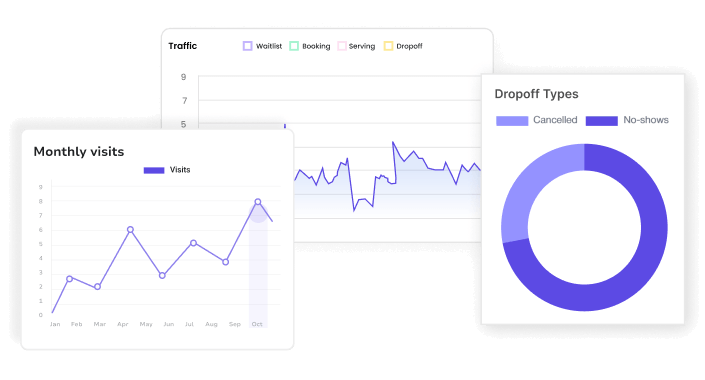
Here’s a simple comparison table of metrics businesses measures but what they should track and its impact on the business operations:
| Metric | What Most Businesses Track | What Leaders Should Track | Business Impact |
| Wait Time | Average across all customers | Peak-hour variance & 90th percentile | Reveals when service breaks down |
| Abandonment | Total count | Abandonment triggers & threshold points | Identifies where friction happens |
| Service Time | Team averages | Variation by staff, time, and task | Surfaces training or process gaps |
| No-Shows | Percentage of missed appointments | Patterns by booking channel & timing | Improves scheduling & reminder strategy |
| Demand Patterns | Monthly or weekly totals | Hourly and seasonal bottleneck forecasts | Enables proactive staffing decisions |
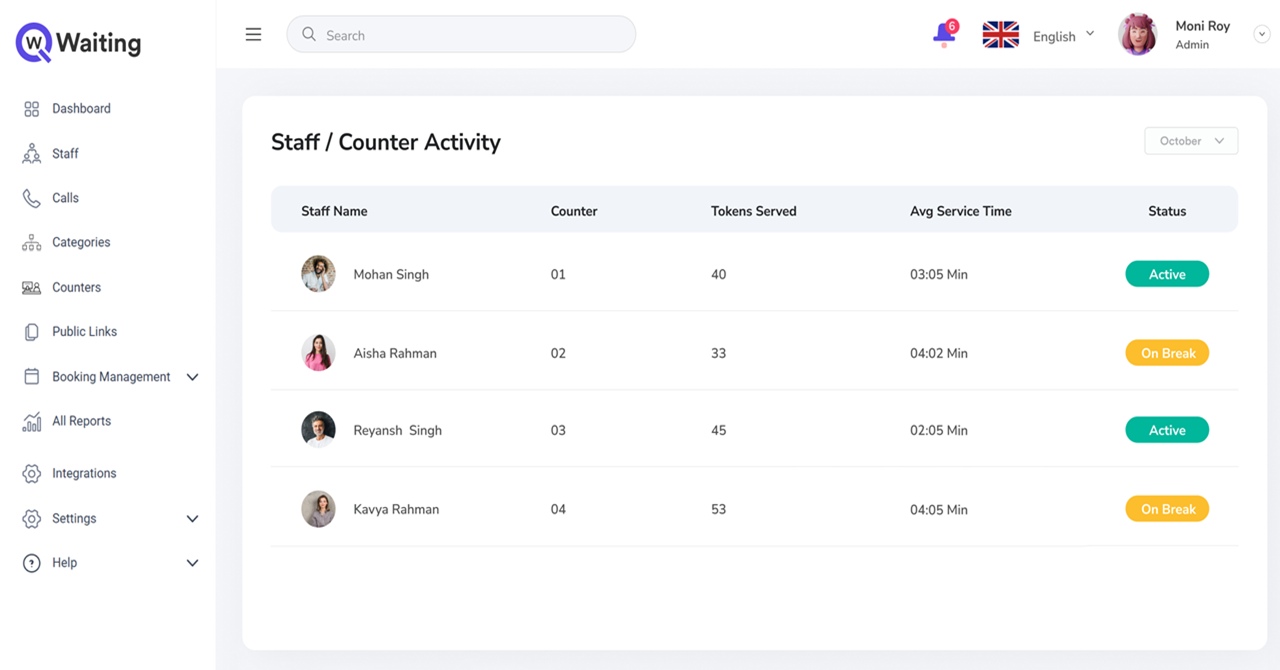
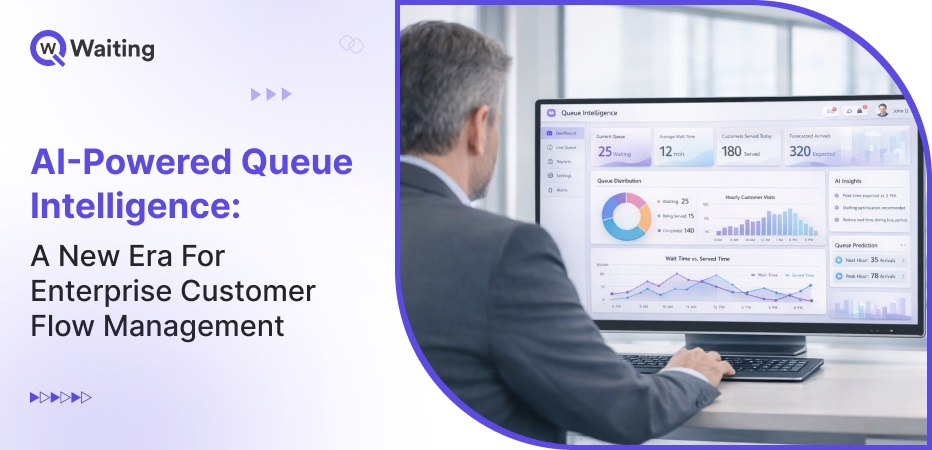
centralized queue dashboards to understand the strategic impact
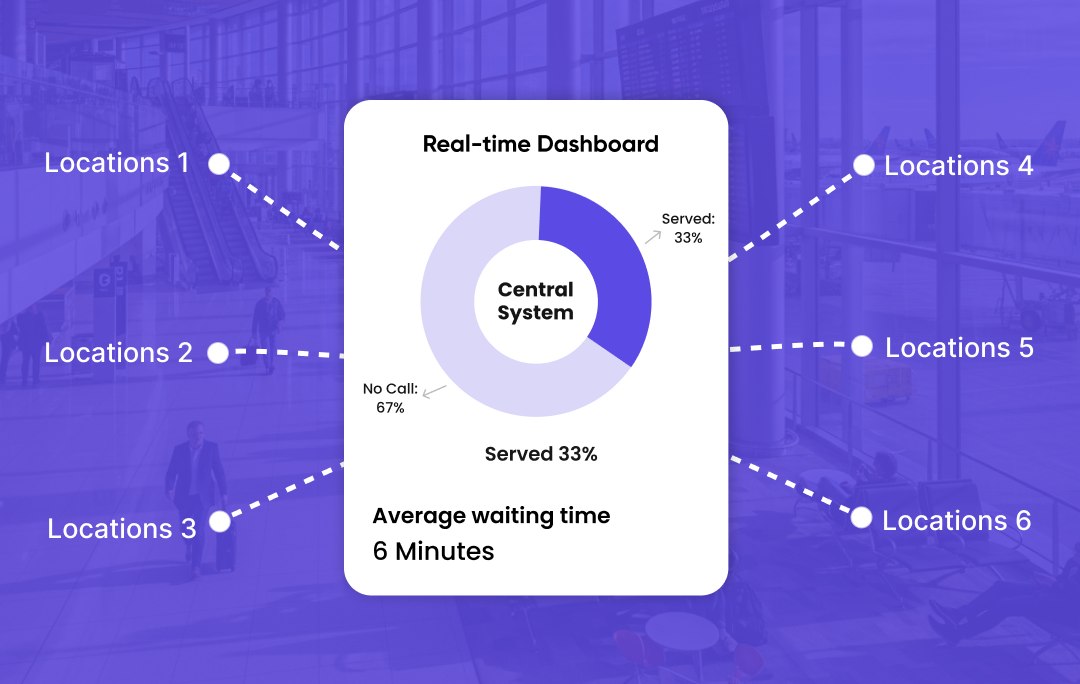
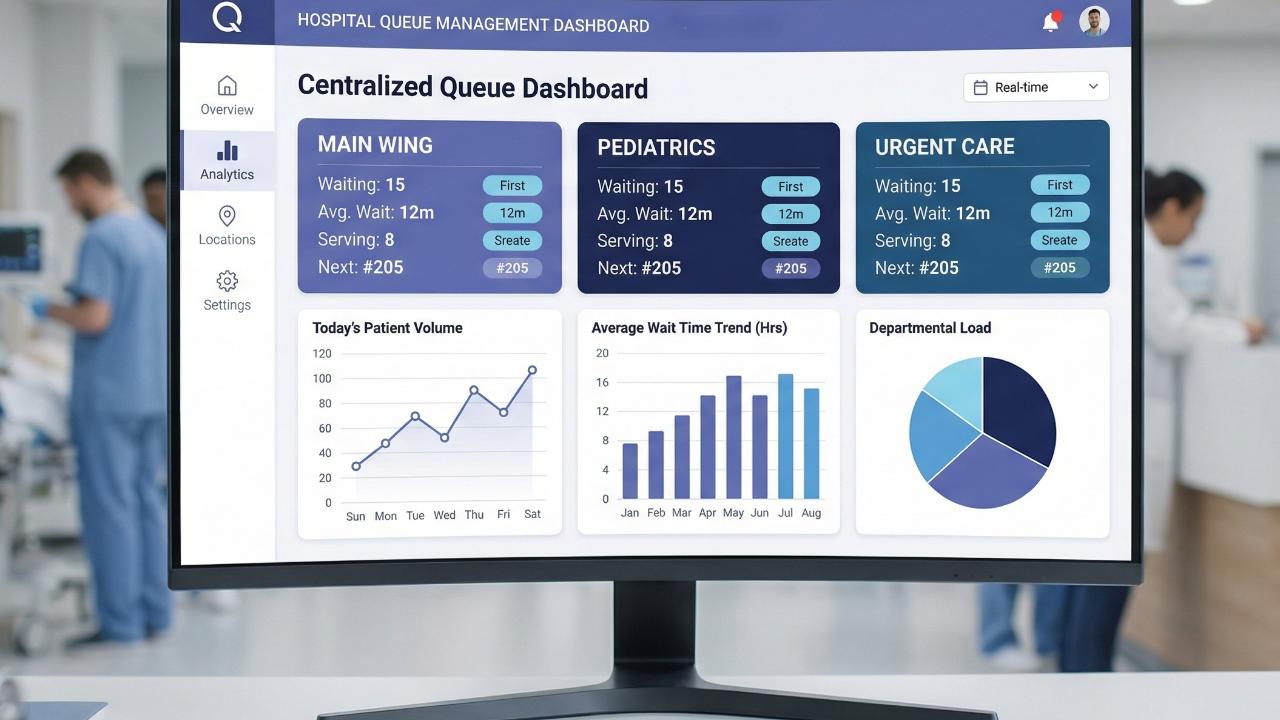
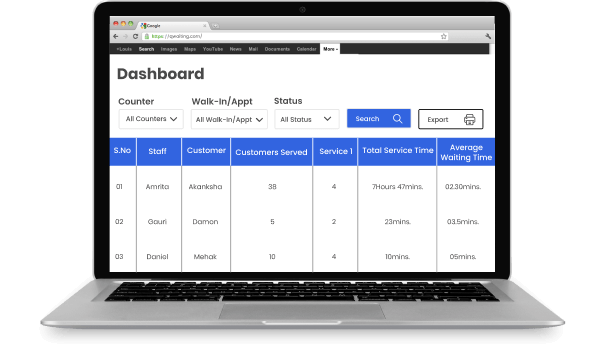
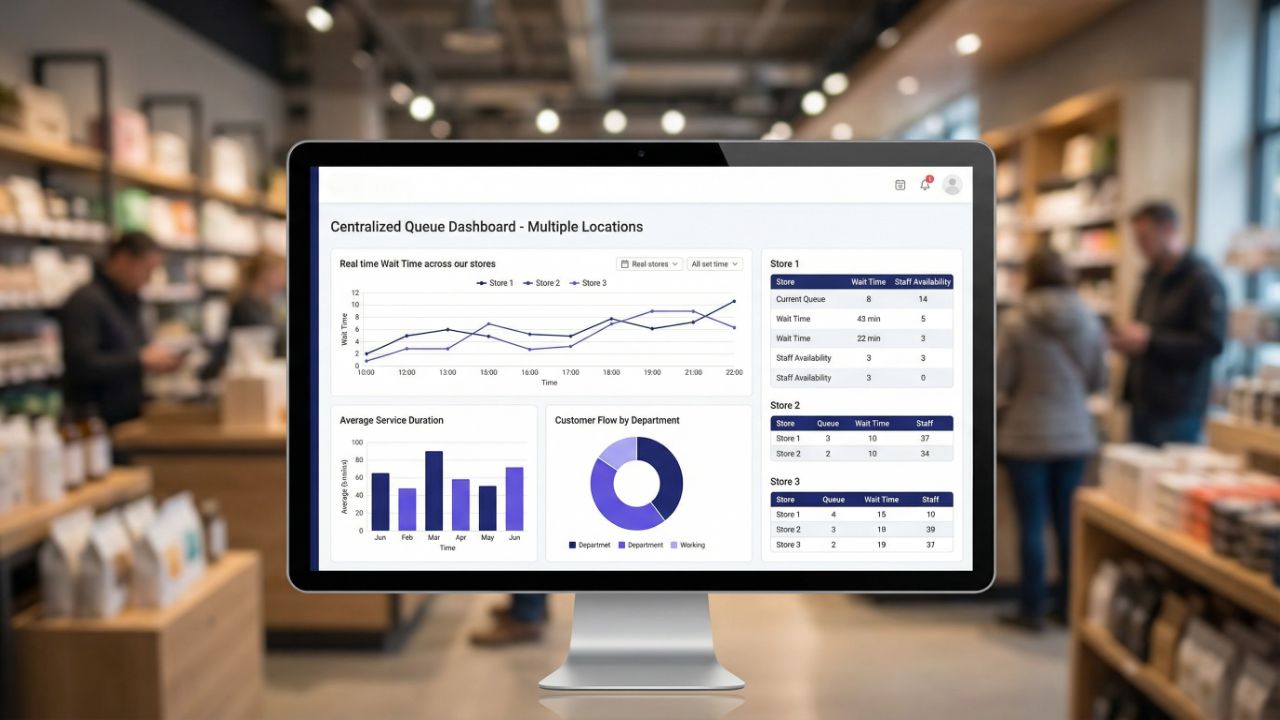
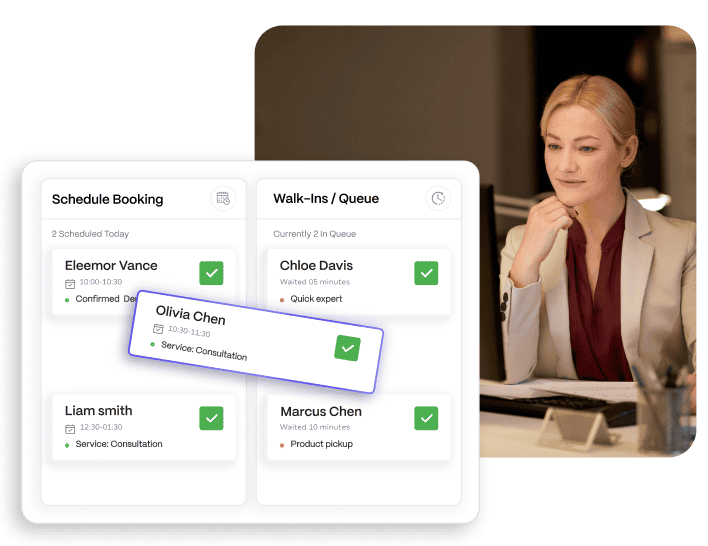
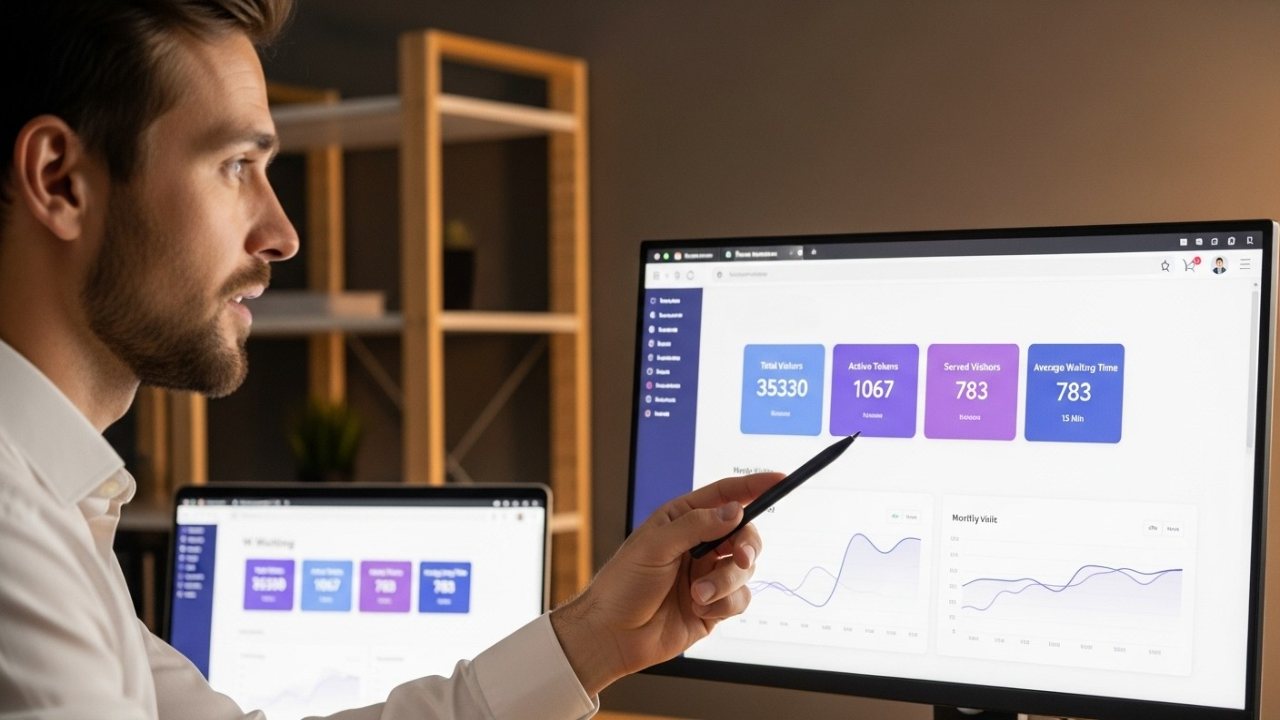
Queue management analytics turns customer flow data into operational insight. It reveals demand patterns, service gaps, and friction points so leaders can improve staffing, reduce churn, and protect revenue before problems become visible in complaints or sales decline.
Leaders should track peak-hour rush, abandonment rates, service-time variation, demand forecasting, and channel behavior, not just averages. These metrics show where breakdowns occur and enable proactive adjustments that keep customers engaged and moving through service efficiently.
Queue data reveals when customers leave before completing transactions, when conversion drops during peak traffic, and where bottlenecks form. These invisible losses rarely appear in sales reports but directly impact revenue and customer lifetime value.
Customers remember their longest delay, not the mean calculation. Without visibility into distribution, peaks, and perceived wait conditions, leadership relies on comfort metrics rather than reality, leading to misinformed operational decisions.
By tracking performance across branches, leaders identify bottlenecks, replicate top-performing workflows, and correct inefficiencies with evidence. This drives standardized service quality while preserving local flexibility and protects brand trust across regions.
Prioritize unified journey visibility, real-time decision support, forecasting capabilities, role-based insights, and cross-location benchmarking. The platform should enable action, not reporting; it should translate data into operational clarity, scalability, and measurable customer experience improvement.