


Deliver fast, reliable service with a cloud system that updates in real-time and scales with your business.

Control your data and infrastructure with a secure, offline-ready solution tailored for complex environments.

Empower customers to check in, book, or update their appointments without staff assistance.

Deliver fast, secure access for repeat visitors using AI-powered facial recognition.
 Banking
Streamline customer flow and reduce wait times in banks and financial institutions.
 Healthcare
Refine patient check-ins and improve healthcare service.
 Public
Sector
Public
Sector
Manage citizen services smoothly in government offices and public institutions.
 Retail
Improve shopping experiences by minimizing checkout lines and wait times.
 DMV
DMV
Organize customer service queues in automotive showrooms and service centers.
 Airport
Speed up passenger processing with efficient queue management at terminals.
All Industries → AI Appointment Booking System
Automate appointment scheduling with AI-powered booking, smart reminders, and seamless customer check-ins.
 Appointment
Booking
Appointment
Booking
Offer flexible scheduling that helps customers plan their visit and avoid peak-time congestion.
 Biometric
System
Biometric
System
Speed up identity verification and check-ins using facial or fingerprint recognition.
 Automation
Automate workflows and reduce manual tasks with smart queue solutions.
 Virtual
Queuing
Virtual
Queuing
Let customers wait from anywhere home, car, or cafe with mobile-based virtual queues.
 Visitor
Management
Visitor
Management
Track and manage visitor entry, exit, and ID verification from a single dashboard.
 Video
Queue
Video
Queue
Allow people to join video calls instantly with one link—no apps, Accessible on any browser.
 Tele-Consultation
Offer seamless virtual consultations with real-time communication tool.
All Solutions →
Watch quick product demos and tutorials to understand how Qwaiting works for your business.

Read expert insights, tips, and industry trends to enhance customer experience.

Download in-depth guides and resources to explore queue management best practices.

Explore Qwaiting in a quick interactive demo, no signup needed.

Here’s how businesses using traditional queuing systems are lacking insights compared to businesses using smart QR-based systems.
| Factor | Traditional Queues | QR-Based Queues |
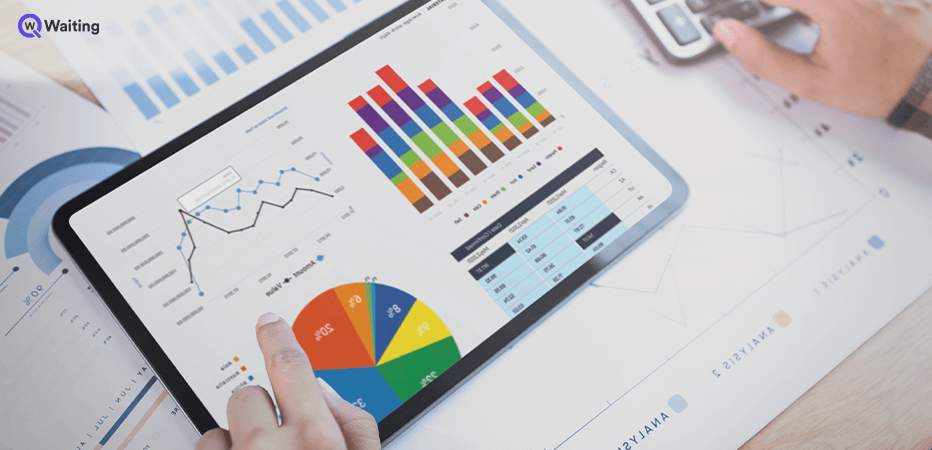
| Visibility | No real-time data | Live queue analytics |
| Customer Control | Fixed location, no autonomy | Wait anywhere, full transparency |
| Scalability | Requires physical expansion | Scales digitally across locations |
| Resilience | Fails under peak pressure | Absorbs surges without breakdown |
| Experience Impact | Passive, frustrating | Active, empowering |

| Metric | Before | After |
| Average Wait Time | 28 minutes | 12 minutes |
| Customer Walkaways | 18% | 4% |
| Staff Load (interactions/hour) | 12 | 19 |
| Service Throughput | 340 customers/day | 520 customers/day |
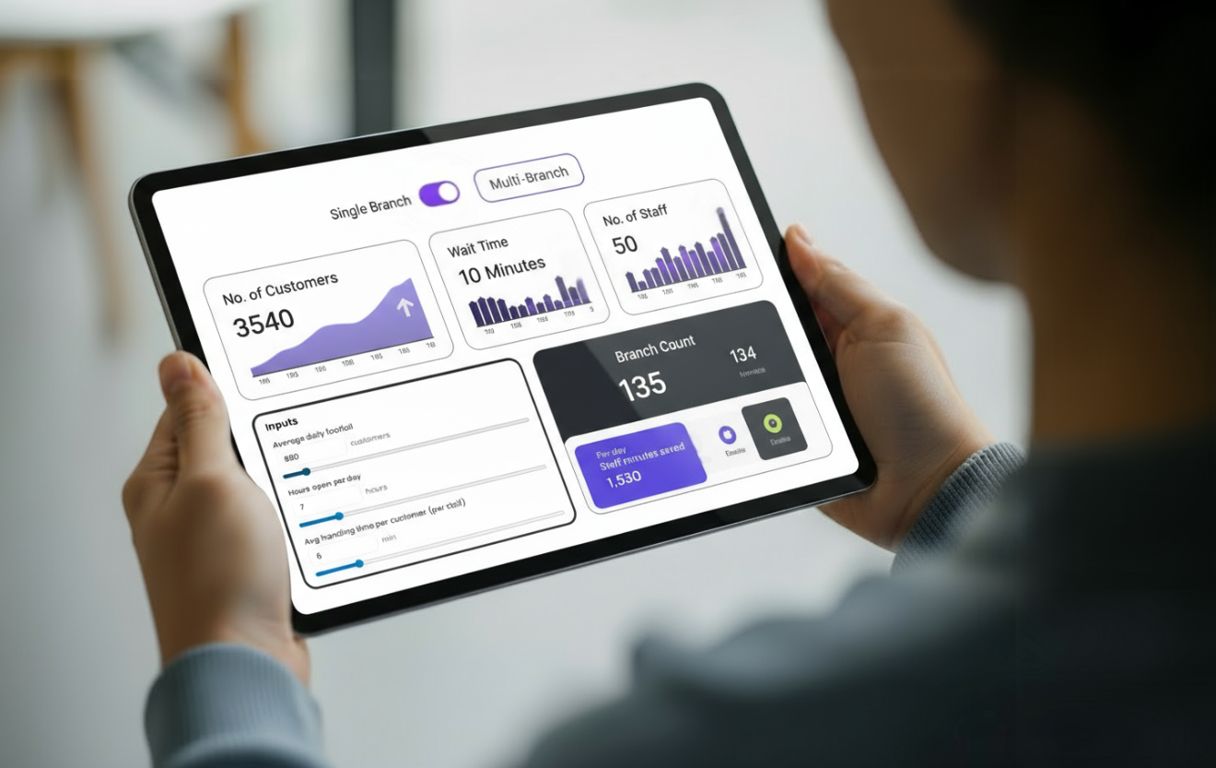
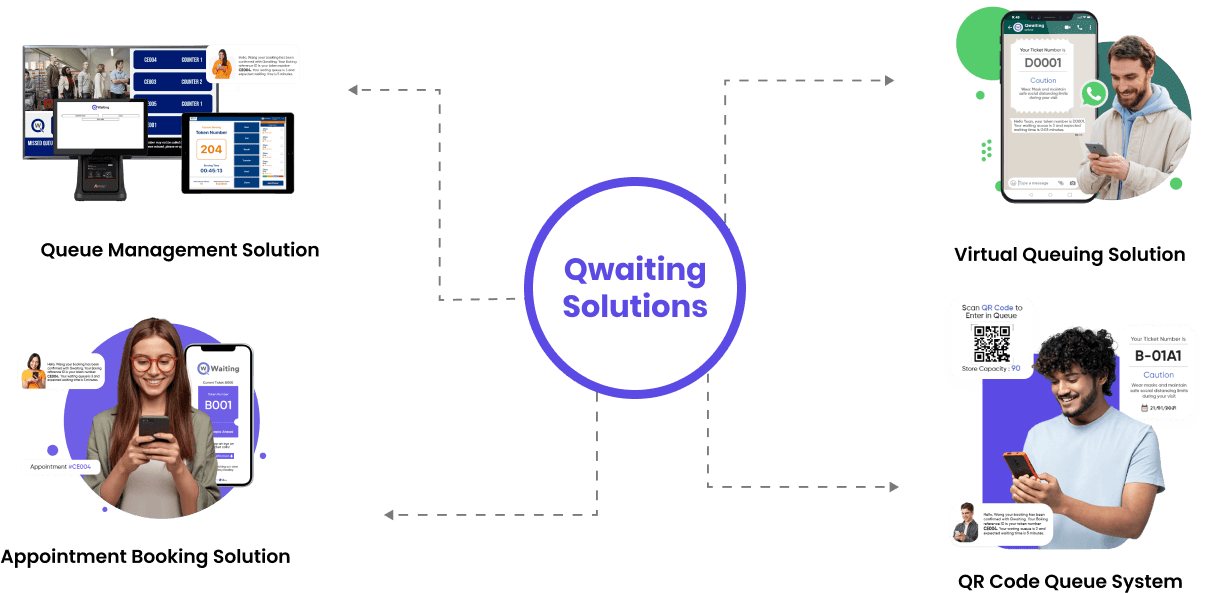
Here’s how basic QR Queue Tools vs Enterprise-Grade QR Queue Platforms
| Capability | Basic Tools | Enterprise Platforms |
| Multi-location scalability | Limited | Centralized + localized control |
| Offline resilience | Fails during outages | Continues service seamlessly |
| Integration depth | Standalone | Full journey orchestration |
| Analytics & reporting | Basic logs | Real-time intelligence + trends |
| Security & compliance | Minimal | Enterprise-grade standards |